This has been a really unproductive week. I was sick with fever for almost three days and could not spend my time on anything. I spent the next days getting the basic svgfig backend for 2d line plots. There are lots of issues with svgfig, and hence I am of the opinion svgfig should be used only for displaying images on the google app engine ie sympy live. First on the list is no support for 3-D graphs. I think this is ok, because there are not many libraries even in javascript which can do 3D plotting. Also, I am having problems with implementing contour plots and surface plots in svgfig. I am experimenting with a way, which would involve using marching squares algorithm to plot contour plots.
I think I am a little behind my gsoc schedule, and I should speed up things a little in the next few weeks.
So these are the things that I have to address
- Integration of svgfig with sympy live
- Fix the multiple spawning of windows in matplotlib issue.
- Fix the plot tests. As of now, the tests do nothing, as the process_series is not called if show is set to False.
- I have been toying around with ipython to get isympy notebook and qtconsole working. The problem I am facing is, there are 2 instances of qtconsole created, instead of one, when I run it. I will have to figure out the problem.
- Address the issues regarding the adaptive sampling of 2d plots.
- Clean up my branch of implicit plotting (This is almost done).
- Split the plot function into plot, plot3d, implicit_plot functions.
I don’t think I will be able to do all of these by the end of gsoc period. But my priority will be getting the implicit plotting and svgfig backend working and getting my pull requests merged.
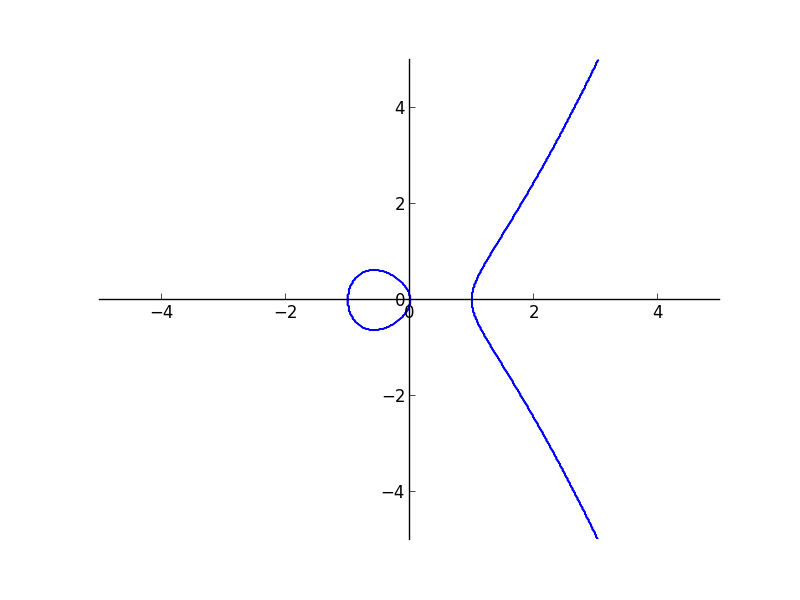
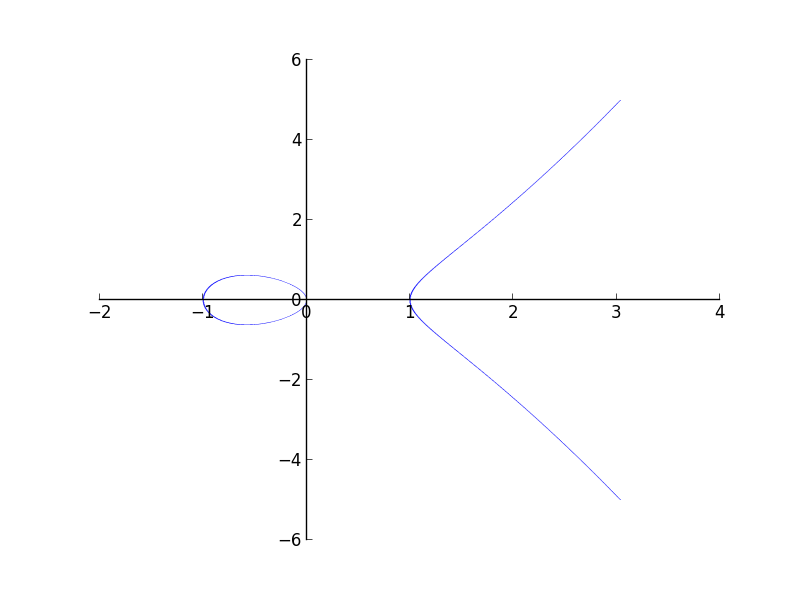
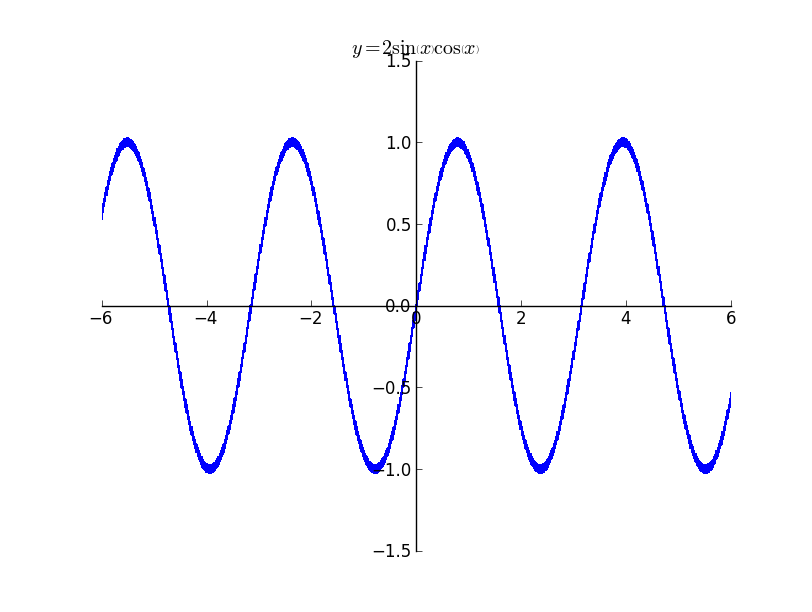
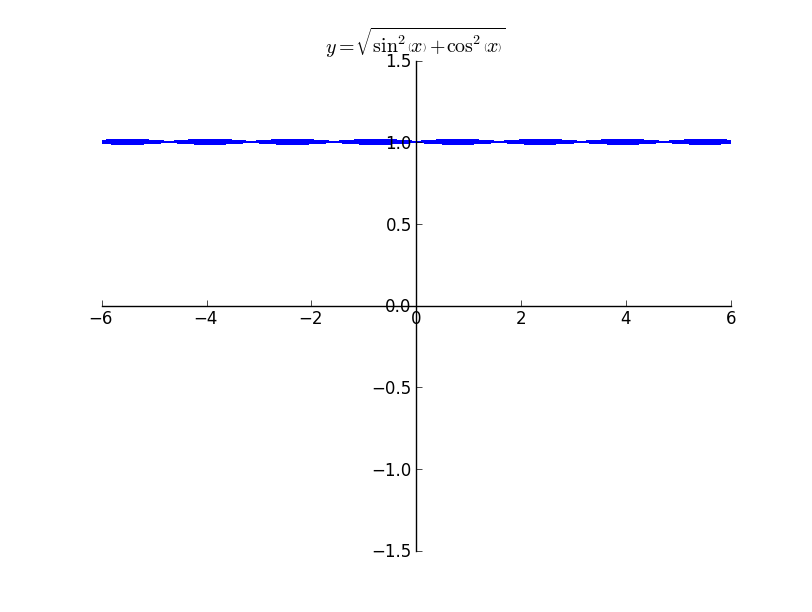
 Even if I increase my depth of recursion to higher values, the thickness becomes less, but doesn’t vanish. The plot actually should have been two separate curves.
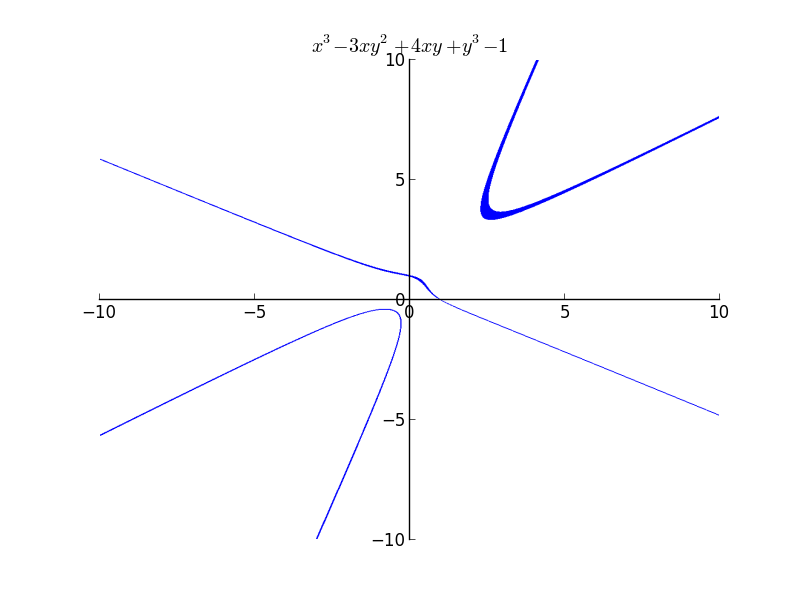
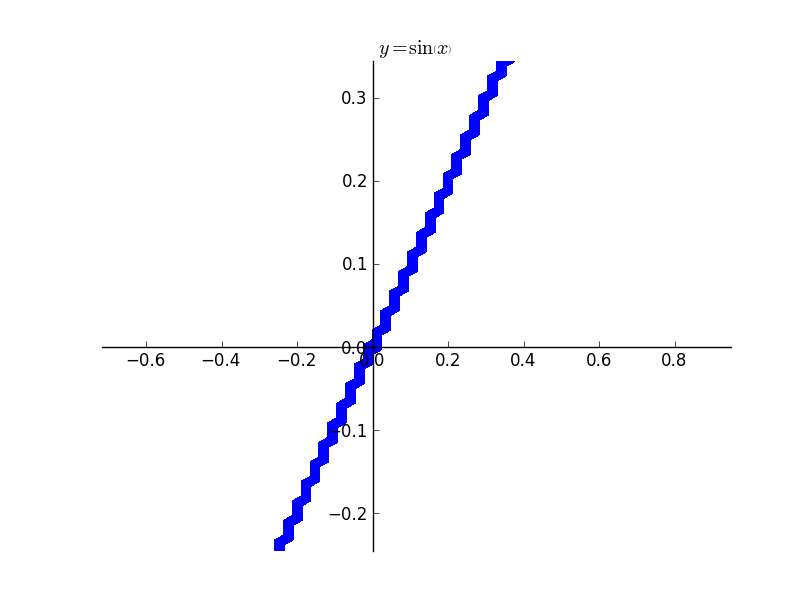
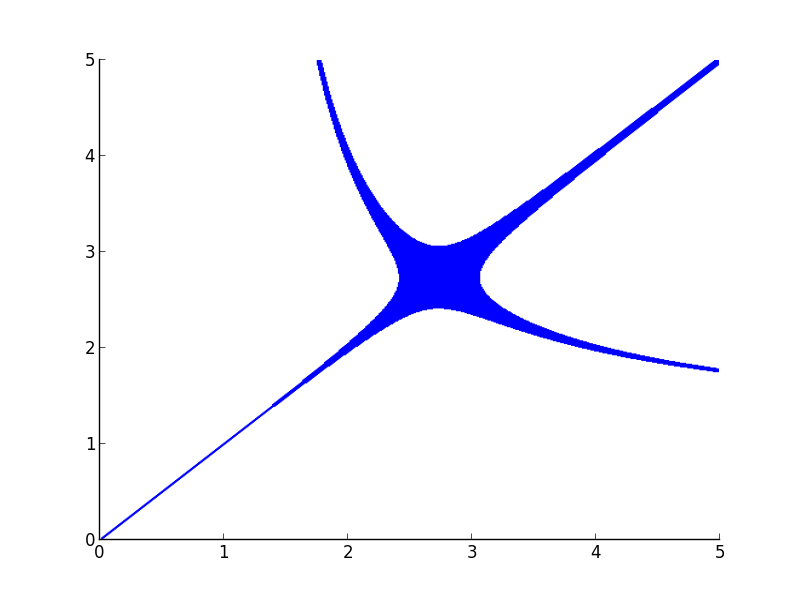
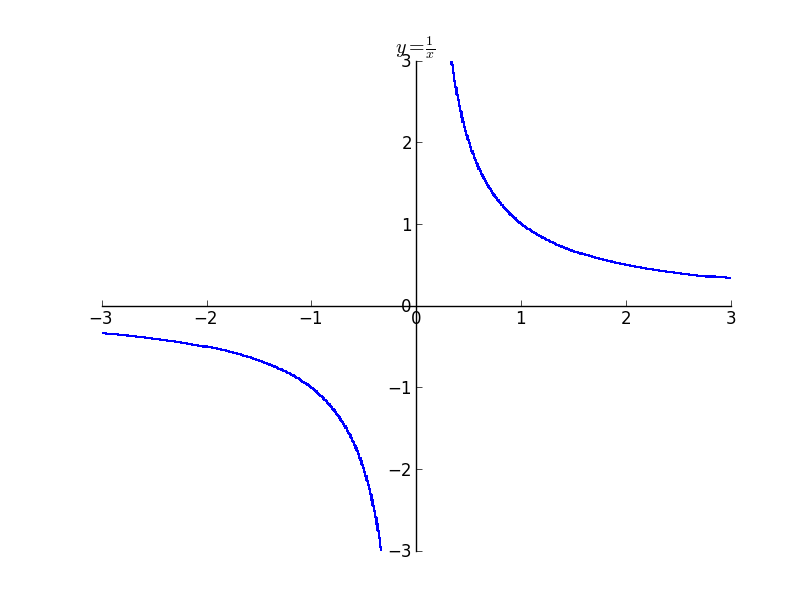 The above image illustrates a plot which does domain tracking and continuity tracking. It is not possible for interval arithmetic without tracking, to decide whether to draw the plots near zero. But with continuity tracking we get an accurate plot.
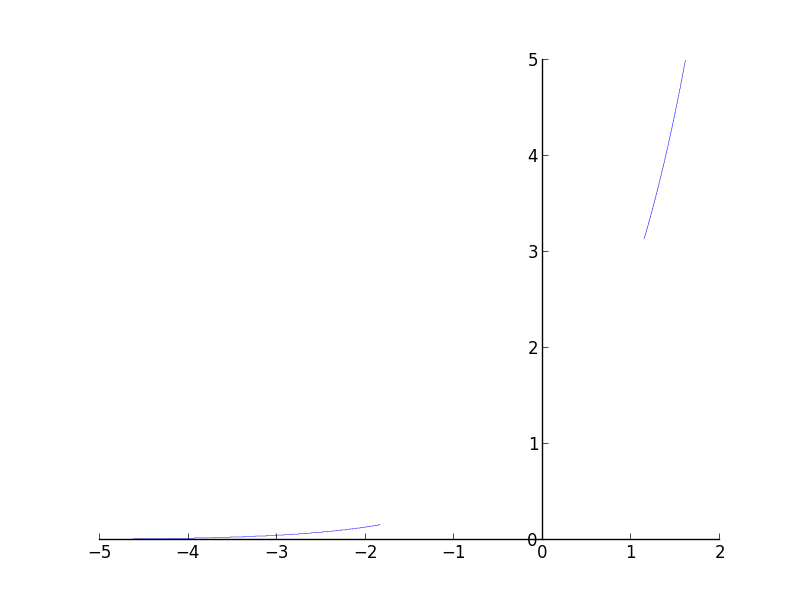
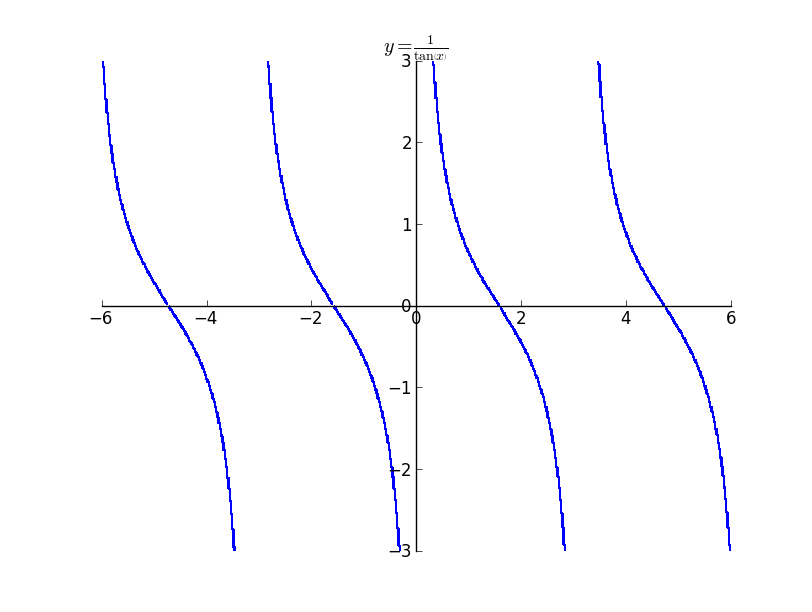 The above plot is that of $y = \frac{1}{\tan{\left (x \right )}}$ . It is possible to see the small discontinuity near multiples of $\pi / 2$ as $\pi / 2$ is not there in the domain of the expression.
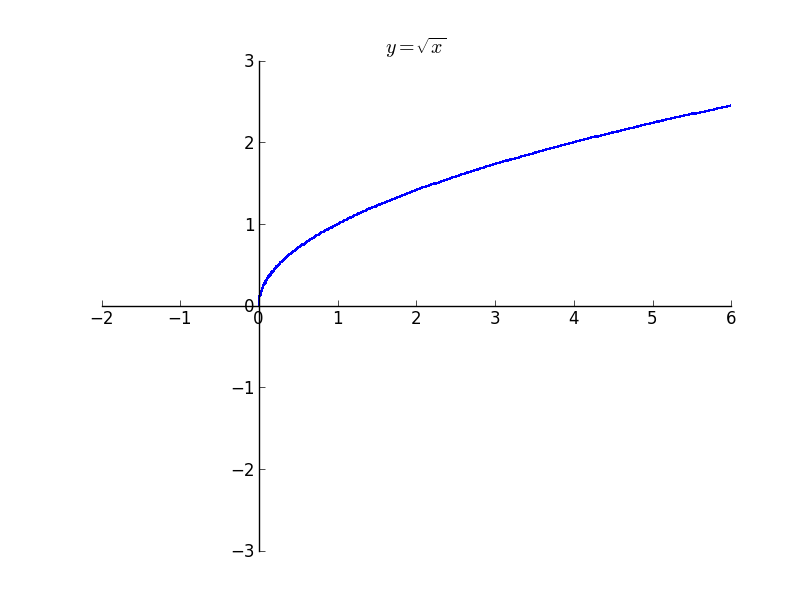 The above plot illustrates how sqrt does not plot anything outside its domain. Even though it appears not that significant, it becomes significant when the huge expression is provided as the argument to the function.
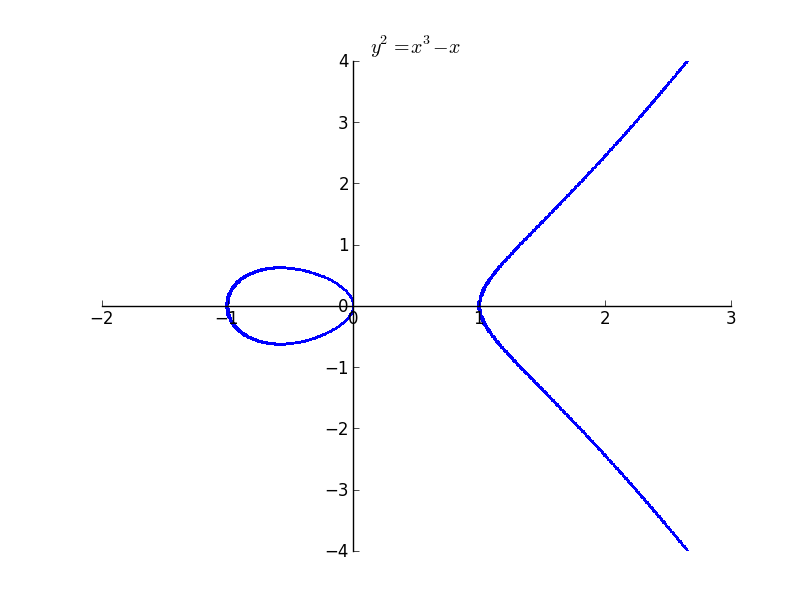
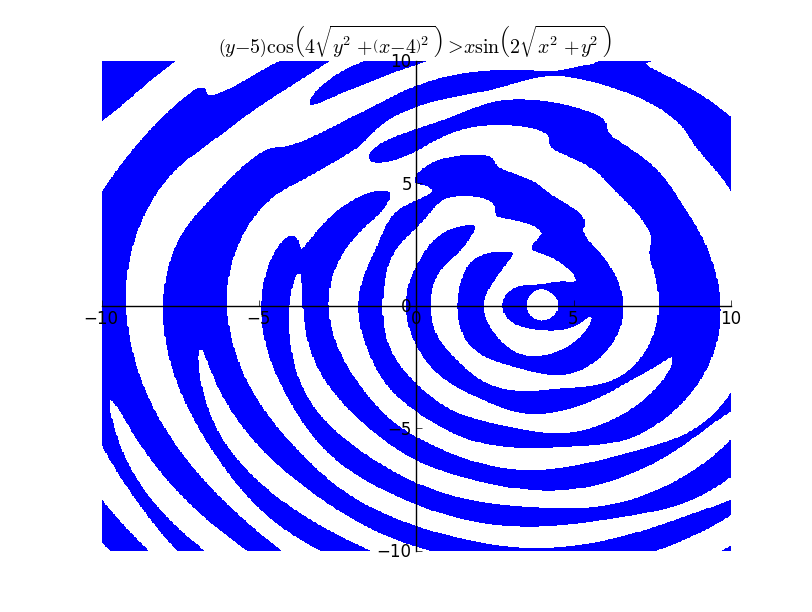 The above plot took 19.26 seconds to render.