My GSoC project is to provide support for implicit plotting using interval arithmetic. As mpmath already has a very good interval arithmetic library, I wanted to try out how efficient the algorithm is going to be using the mpmath interval arithmetic library. I wanted to get an idea on the time required for plotting and also wanted to decide whether to write my own interval arithmetic library or use the existing mpmath library and add additional things to it. I have a basic implementation which supports only the mpmath interval arithmetic functions. The results look promising and I am guessing a separate implementation for plotting will be faster and I will be able to add features more easily.I have an image of $y > 1/x$ with the interval edges below. The image below was plotted so with a resolution of 1024x1024. It is possible to see how the intervals are subdivided more and more when it reaches the edge of a region.
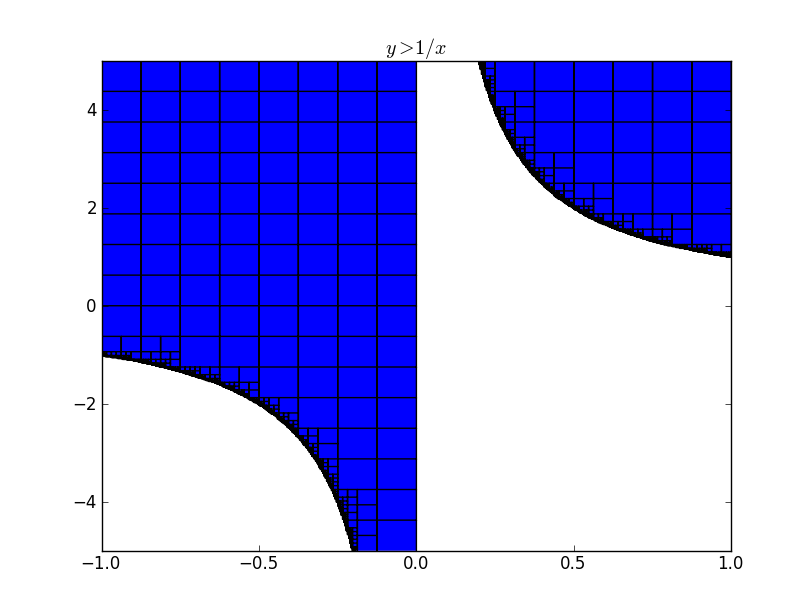
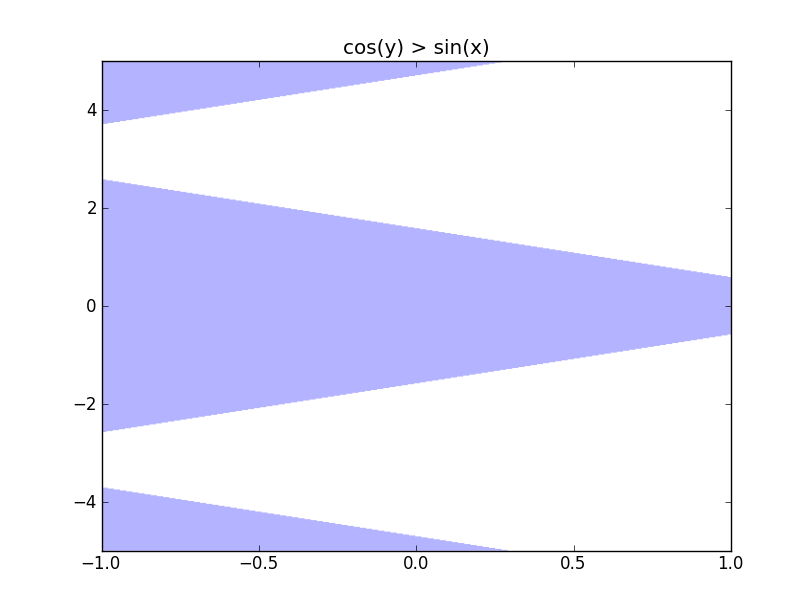
It took 1.57 seconds to render this image which is decently fast. I observed that if the independent regions are less and large, then the time take for the plot to be rendered is high. I tried $cos(y) > sin(x)$ which took about 5.3 seconds to render.
I wanted to try what the maximum time it takes to render something. So I tried plotting $sin^{2}x+cos^{2}x$ less than 1. As the arithmetic is done on intervals, it is not possible for the algorithm to decide that the expression is not true throughout the interval. So it goes on subdividing more and more, until it reaches a dimension of 1 pixel. For a resolution of 512X512, it took 120 seconds to render. If there are a lot of evaluations in the expression, then it might increase, but we should be expecting times around 120 seconds.
Another problem that I have to address is rasterization. I am really not getting any ideas on how to avoid rasterization. One way is to handle the zoom event in matplotlib and change the data to match the zoom. But for complicated graphs, revaluating might take a lot of time, which is bad.
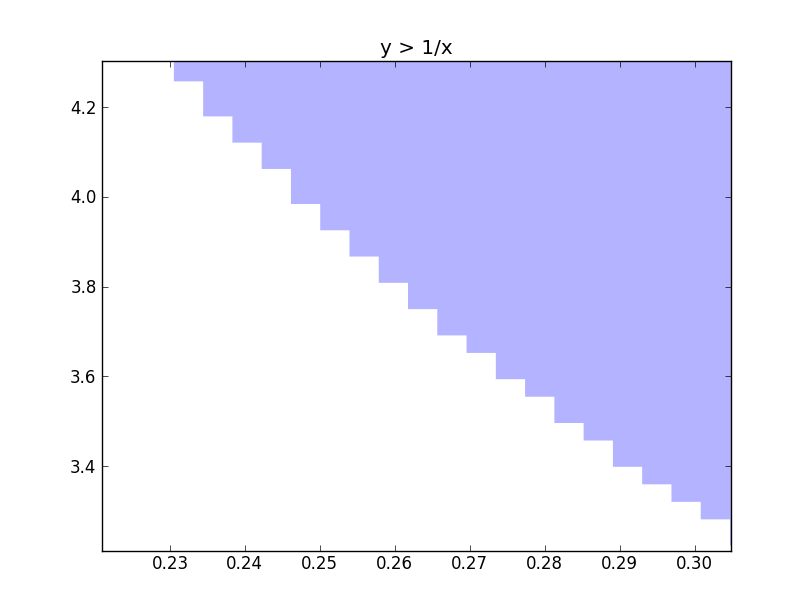
We can see that if there is a way of interpolating over the rectangular edges, then we will have a plot without rasterization. I haven’t got any foolproof idea to implement this interpolation as there will be many independent regions. So if you have any idea, then please comment or mail me :). The code for plotting can be found here.